After working on websites for many years, one thing I have learned is that fixing a website issue is not about randomly changing code and hoping something works.
The first step is understanding what is actually happening.
Whenever I see a layout breaking, a button not working, an image not loading, or a strange issue reported by a client, one of the first things I open is Chrome Developer Tools.
Many times, the solution is already visible there.
We just need to know where to look.
What is Chrome Developer Tools?
Chrome Developer Tools (usually called Chrome DevTools) is a collection of tools built directly inside Google Chrome.
You do not need to install anything separately.
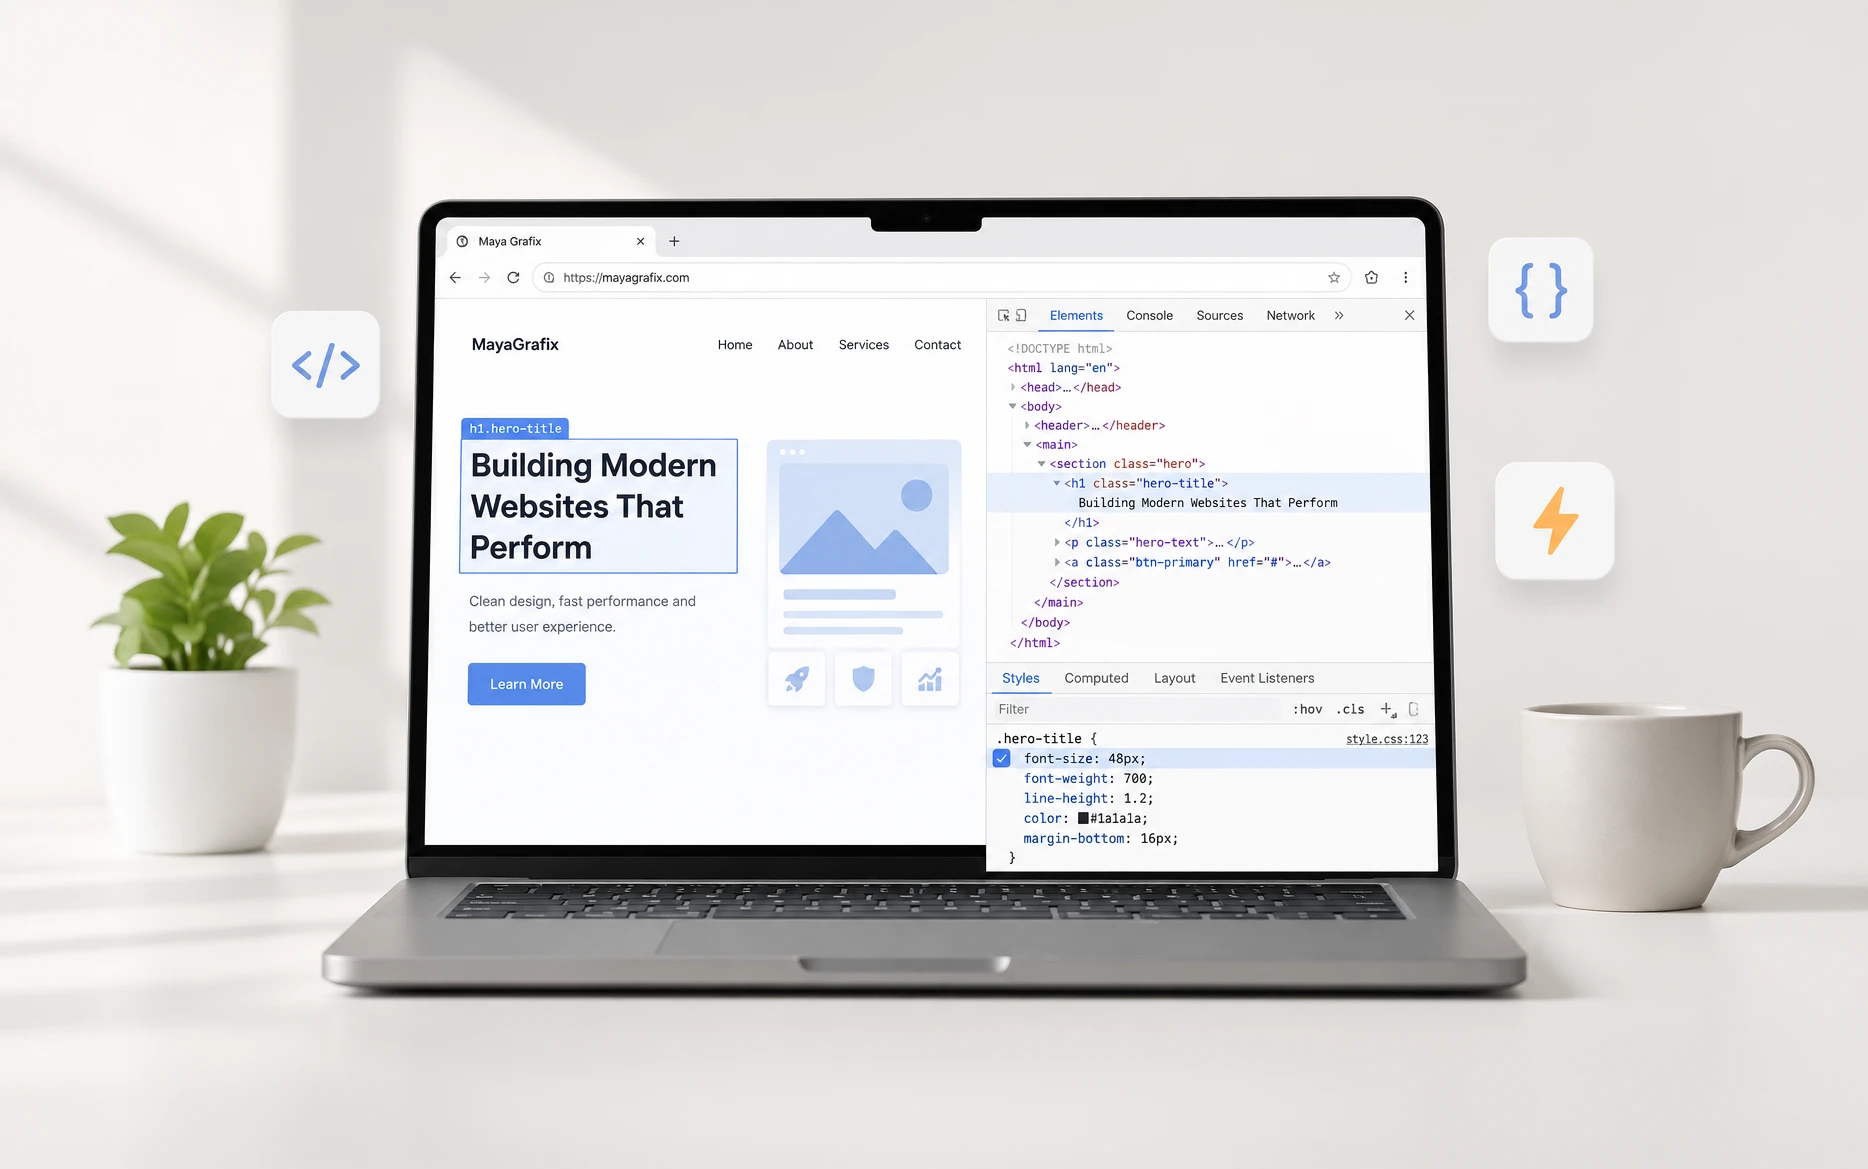
Right-click anywhere on a webpage, select Inspect, or press F12 and you get access to the actual structure of the webpage, CSS styles, JavaScript errors, network requests, performance information, and much more.
For developers, it is almost like looking under the hood of a website.
A visitor only sees the final page.
DevTools shows us how the browser created that page.
Guessing Is Not Debugging
This is something I see many beginners do.
A button is not aligned properly.
They open the CSS file and start changing margins and padding.
The color is wrong.
They search through multiple files trying to find where the style came from.
This approach wastes a lot of time.
I personally prefer inspecting the element first.
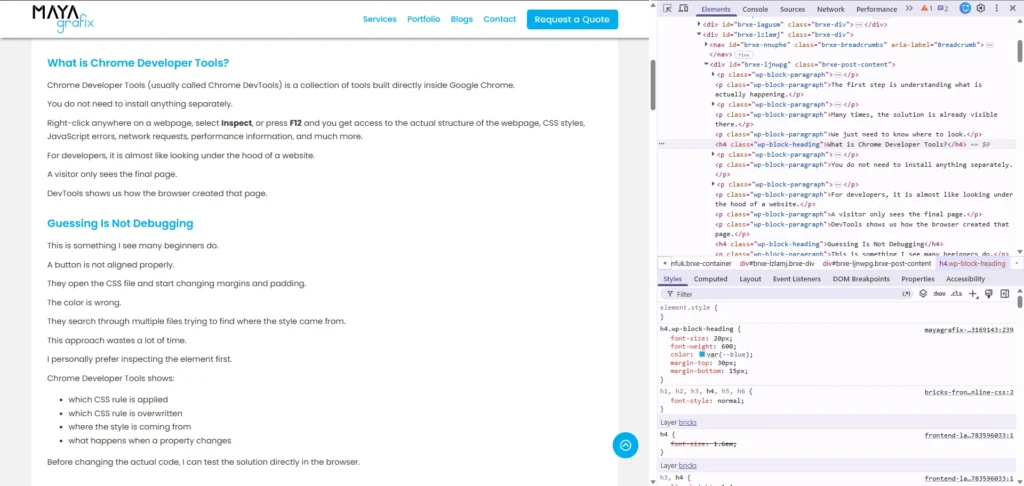
Chrome Developer Tools shows:
- which CSS rule is applied
- which CSS rule is overwritten
- where the style is coming from
- what happens when a property changes
Before changing the actual code, I can test the solution directly in the browser.
Fixing CSS Problems Using Inspect Element
The Elements panel is probably the feature I use the most.
It shows the HTML structure of the page and all the CSS affecting an element.
For example, if a heading has unexpected spacing, I can inspect it and immediately check the margin, padding, font size, inherited styles, and overwritten CSS.
I can disable CSS properties, add new ones, and test different values instantly.
Many times I solve the problem inside DevTools first.
Only after confirming the fix, I update the actual CSS file.
Testing Responsive Design Issues
Responsive problems are very common in web development.
A website may look perfect on desktop but have issues on mobile.
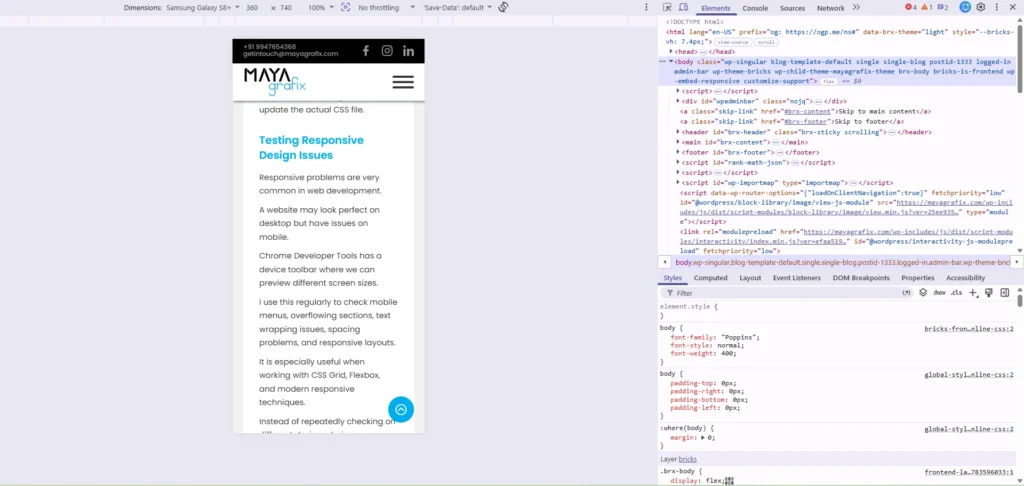
Chrome Developer Tools has a device toolbar where we can preview different screen sizes.
I use this regularly to check mobile menus, overflowing sections, text wrapping issues, spacing problems, and responsive layouts.
It is especially useful when working with CSS Grid, Flexbox, and modern responsive techniques.
Instead of repeatedly checking on different devices during development, DevTools helps quickly identify where the layout starts breaking.
Finding JavaScript Errors Using the Console
Sometimes a website looks fine visually, but something does not work.
A button click fails.
A slider stops working.
A popup does not open.
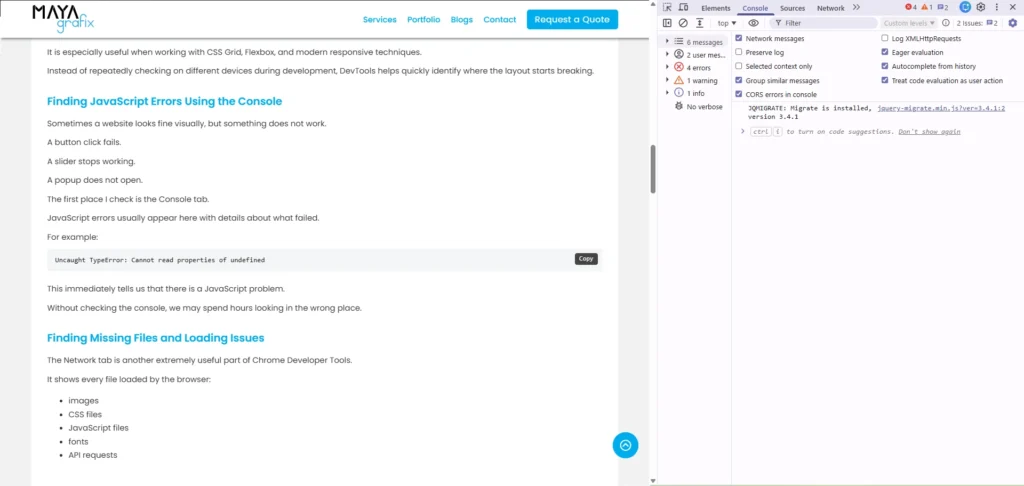
The first place I check is the Console tab.
JavaScript errors usually appear here with details about what failed.
For example:
Uncaught TypeError: Cannot read properties of undefined
This immediately tells us that there is a JavaScript problem.
Without checking the console, we may spend hours looking in the wrong place.
Finding Missing Files and Loading Issues
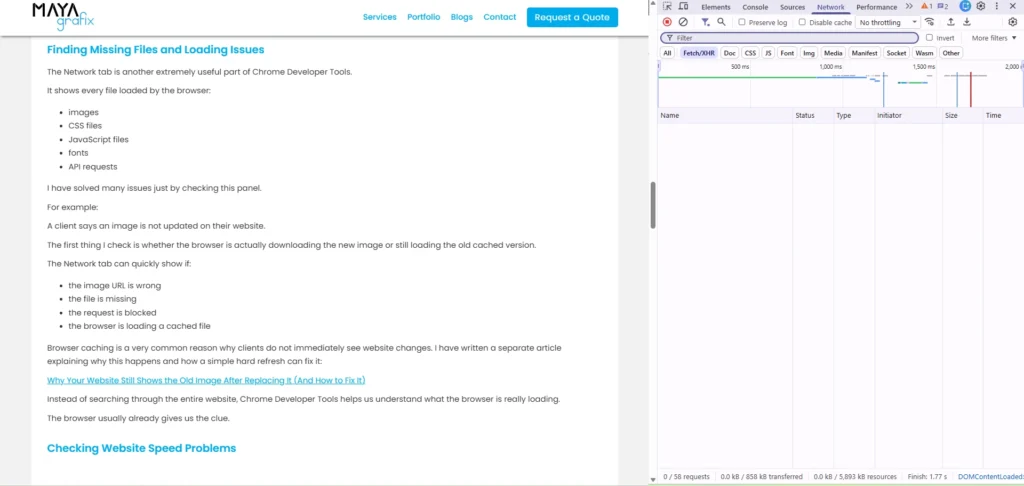
The Network tab is another extremely useful part of Chrome Developer Tools.
It shows every file loaded by the browser:
- images
- CSS files
- JavaScript files
- fonts
- API requests
I have solved many issues just by checking this panel.
For example:
A client says an image is not updated on their website.
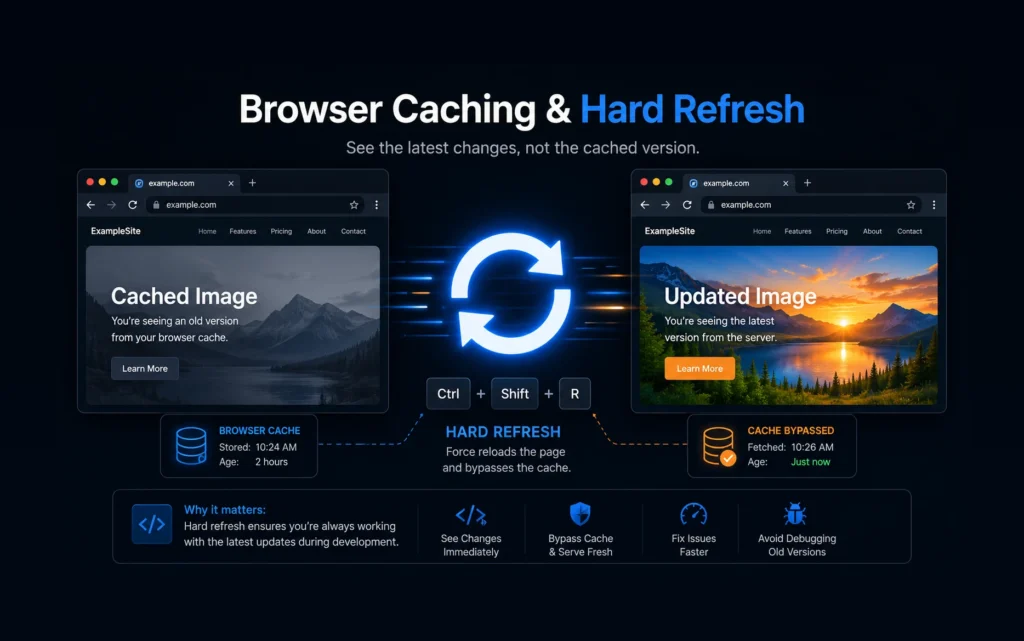
The first thing I check is whether the browser is actually downloading the new image or still loading the old cached version.
The Network tab can quickly show if:
- the image URL is wrong
- the file is missing
- the request is blocked
- the browser is loading a cached file
Browser caching is a very common reason why clients do not immediately see website changes. I have written a separate article explaining why this happens and how a simple hard refresh can fix it:
Why Your Website Still Shows the Old Image After Replacing It (And How to Fix It)
Instead of searching through the entire website, Chrome Developer Tools helps us understand what the browser is really loading.
The browser usually already gives us the clue.
Checking Website Speed Problems
When a website feels slow, guessing the reason does not help.
It may be large images, too many scripts, slow server response, or unnecessary files loading.
The Network panel helps identify which files are slowing down the page.
Chrome DevTools also includes Lighthouse, which can analyze:
- performance
- accessibility
- SEO basics
- best practices
These reports help identify areas that need improvement.
Debugging WordPress Websites
Since I work with WordPress regularly, Chrome Developer Tools has become part of my daily workflow.
When working with builders like Bricks Builder or Elementor, the final output is still HTML, CSS, and JavaScript.
DevTools helps me inspect:
- generated HTML structure
- CSS classes
- custom styles
- plugin conflicts
- JavaScript errors
Even when using visual builders, understanding what happens in the browser makes solving problems much easier.
A Real Developer Workflow
My usual process when something is not working:
- Open Chrome Developer Tools.
- Inspect the affected area.
- Check the HTML and CSS.
- Look for Console errors.
- Check Network requests if files are involved.
- Test the fix in the browser.
- Update the actual code.
This workflow saves a lot of unnecessary changes.
Find the problem first.
Then fix it.
Best Practices When Using Chrome Developer Tools
Do not randomly edit files before inspecting the issue.
Always check the browser output first.
Remember that DevTools changes are temporary. Refreshing the page removes them.
Use it as a testing environment before applying permanent fixes.
The more you use it, the faster you become at identifying problems.
Final Thoughts
Chrome Developer Tools is one of those tools I use almost every day.
It does not write code for us.
It does something more important.
It shows what is actually happening inside the browser.
In my experience, good debugging is not about knowing the answer immediately.
It is about knowing where to look.
And many times, Chrome Developer Tools is the best place to start.
FAQs
Chrome Developer Tools is used to inspect, test, and debug websites directly inside the browser. Developers use it to check HTML structure, CSS styles, JavaScript errors, network requests, website performance, and responsive layouts.
No. Chrome Developer Tools is built into Google Chrome.
You can open it by right-clicking on a webpage and selecting Inspect, or by using Ctrl + Shift + I on Windows and Cmd + Option + I on Mac.
Yes. You can temporarily edit HTML and CSS inside Chrome Developer Tools to test changes.
However, these changes happen only inside your browser. After refreshing the page, the changes disappear.
Once you find the correct solution, update the actual website files.
Chrome Developer Tools only modifies the current page loaded in your browser.
It is designed for testing and debugging.
To make the changes permanent, add the code to your CSS file, theme, or website builder.
Yes. The Console panel displays JavaScript errors and warnings.
This helps developers quickly identify scripts that are broken or causing problems.
Yes. The Network panel and Lighthouse tools can help identify large files, slow requests, unused resources, and other performance issues affecting website loading speed.
Yes. WordPress developers can use Chrome Developer Tools to inspect theme styles, debug plugin conflicts, check builder-generated code, test CSS changes, and troubleshoot JavaScript issues.
Yes. Beginners do not need to learn every feature immediately.
Starting with Inspect Element, Console, and Network tabs is enough to solve many common website problems.